Plots Line that is interrupted, when no values are available

0 192 Views 1 Comment 50 Tipped Credits 8 months ago
HTS CLOUDBETA
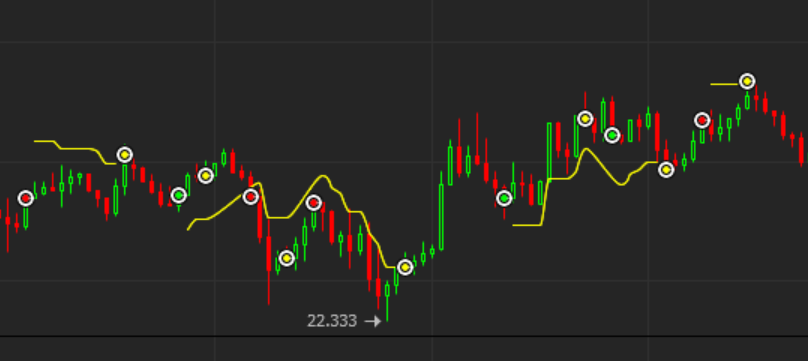
  • This command plots a line that is interrupted, when you provide no values.

    It might be usefull, for instance, when you have a trailing stop loss active during an active position.
    When there is no placed position, then you don’t need the trailing stop loss marker.

    Warning: The plot might be sometimes inaccurate. I haven’t figured you, yet, what the error criteria is.

    HaasScript Code
    Sign in or Register to download for free
  • Mandala Trading Competition Promotion Type: contest Expires: June 9, 2023 Exclusive
    Trading volume competition, win up to $10,000 USDT and bounties.
  • Earn Up to 200 BMEX Tokens Promotion Type: contest Expires: March 31, 2023
    15 BMEX @ $20,000, 25 BMEX @ $50,000, 50 [email protected] $200,000, 100 BMEX @ $400,000, 200 BMEX @ $600,000 in monthly derivatives volume
    • #3178
      pshai
      Admin
      Up
      0
      Down
      ::

      Nice utility script! But I’m not sure why you would need to take the color input as a StringType, when you could just use EnumType directly? Then you do not have to use color_to_enum function.

      EDIT: AAHH, silly me! I understand why that function exists… 😉

      • This reply was modified 8 months ago by pshai. Reason: im stoopid
      50 HaasScript Credits
Login or Register to Comment

Unlock your crypto trading potential

Create a free account and enjoy everything we have to offer.

Join for Free