-
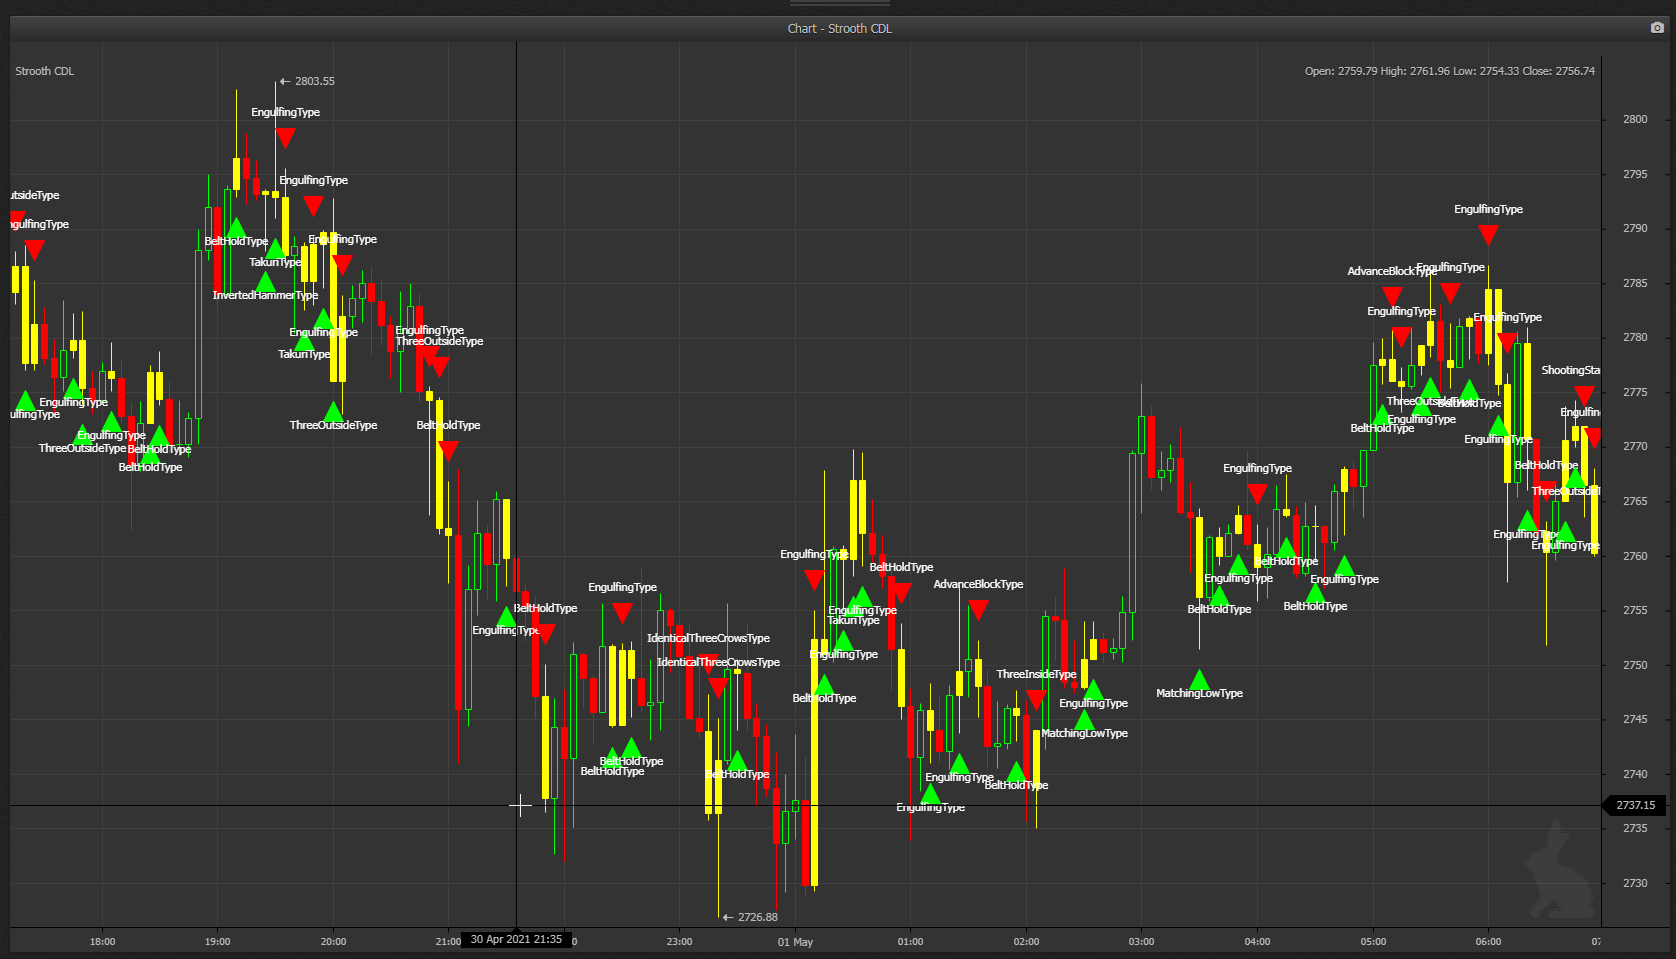
Scans price chart for defined list of known bullish/bearish candle patterns and their directions. The patterns were found on http://thepatternsite.com/patternz.html and I adapted as best I could.
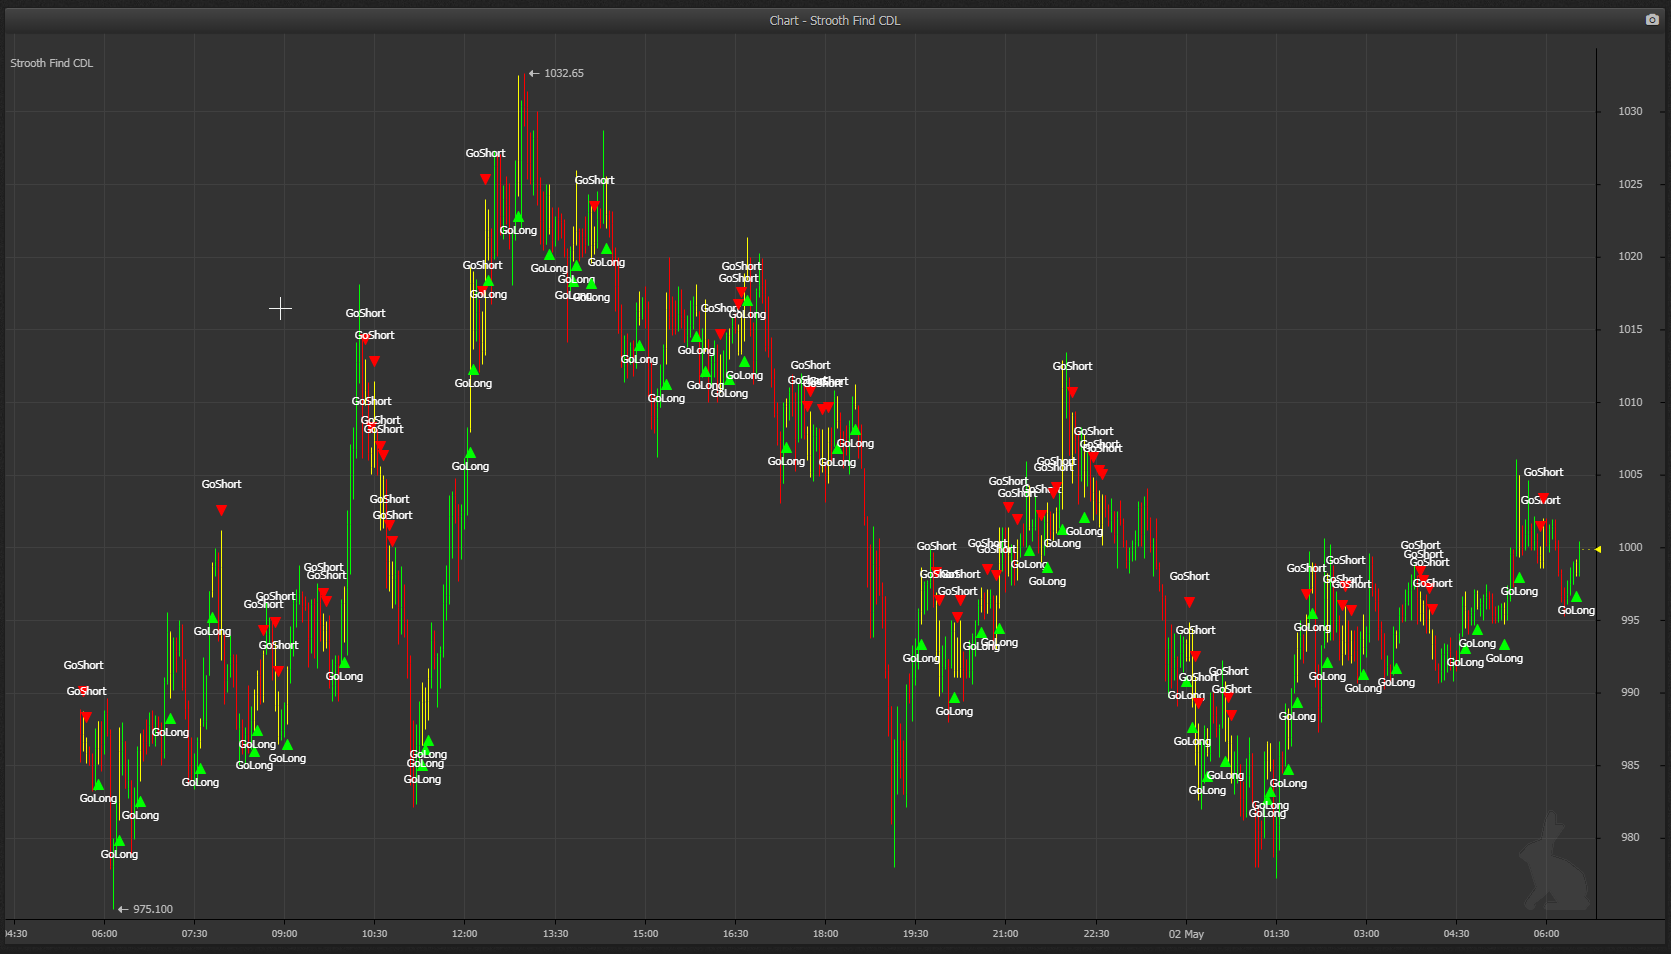
This will scan for up/down breakout, reversal/continuation and based on the long/short weight it will signal the heavier side. You can adjust the weights and penetration to suit and enable the plotting if you would like. The amount of iteration this command does unfortunately makes it quite slow. I’m not sure if there is anything that can be done to speed up my code but all ears if someone knows the answer. As they say, best used on longer time frames as you will get lots of false positives on short ones.
There is one issue that I believe exists – if it detects more than one pattern at the same candle the last found pattern will be the one plotted as it overwrites the previous plot data afaik. Based on the weighting this should not affect the signal however.
You can just call it like so
local signal = CC_StroothCDL()Or specify the settings to fine tune a little more if you like
local signal = CC_StroothCDL(1, CurrentInterval(), {OpenPrices(), HighPrices(), LowPrices(), ClosePrices()}, 3, 3, 4, false, false, false)