-
While clearing out my library saw multiple versions of this one, none of them finished, so made a start. removing the rest (default plotting to index1 and not making the parameter is bound to make a mess but you do catch on after a while, perhaps a case of persistence luck..)
Just needed to fill in the blanks!
Beautified the histogram, and added the nicest most functional plotting to date, for testing purposes,.
This is still work in progress, but can’t take on every half finished , let alone if not my own..
Need to get back to deleting, already removed over 600, still killing it..
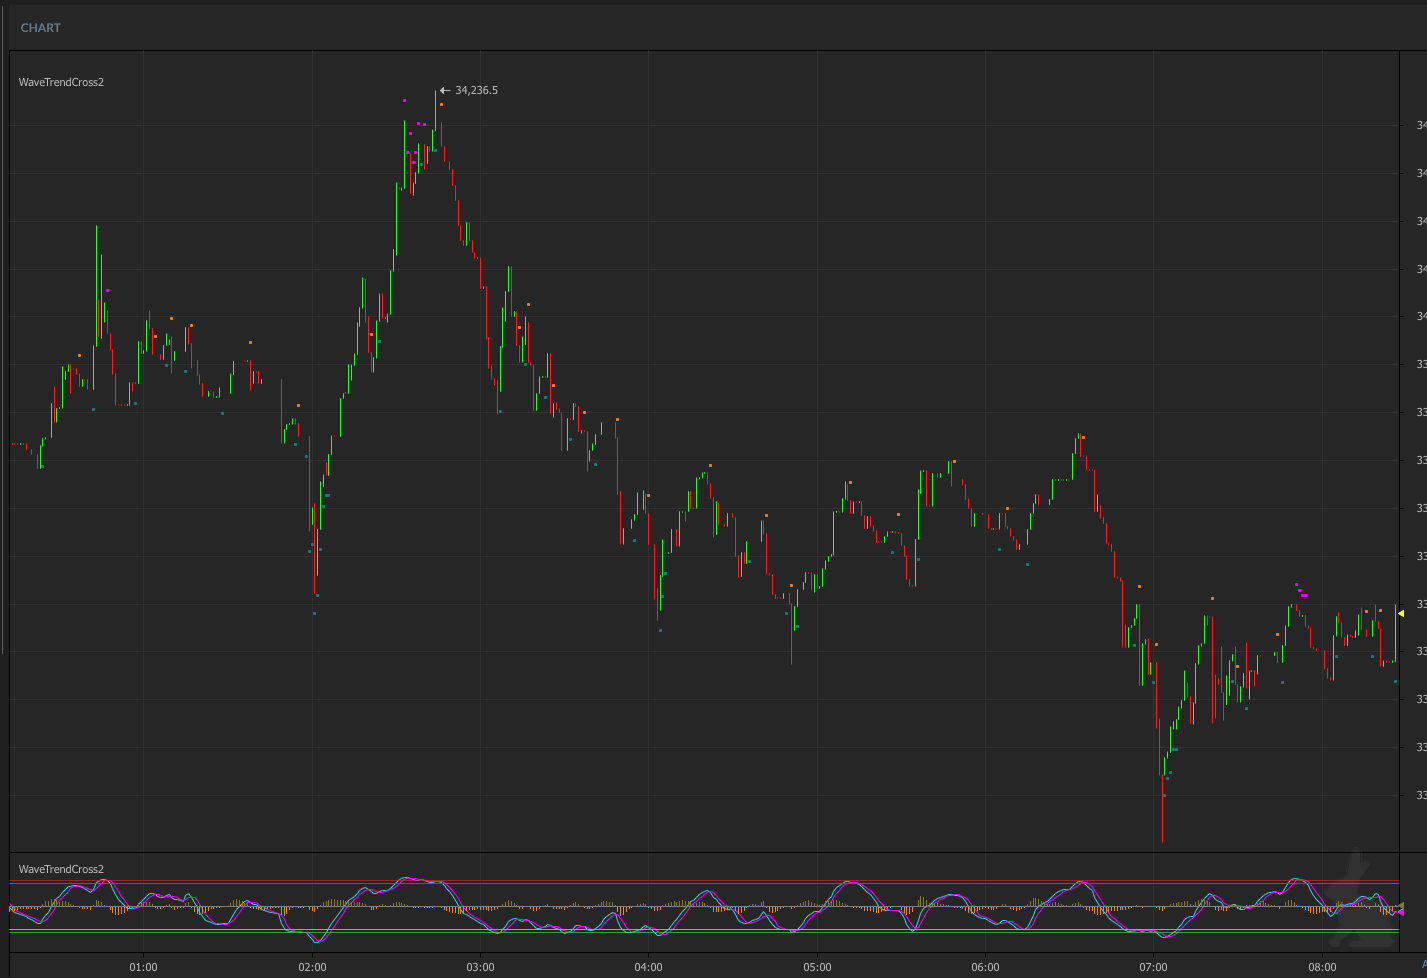
The signal logic could use an input options
because in down/up trend the crosses when not OB OS are still the tops and bottoms
As seen in plots
for signal used OBS levels 1 made these the inner levels OBS2 the outer more OB OS thresholds
so could add verystrongcbuy cross and below os2 , verystrongcsell cross and above ob2 etc